Examining detector geometry
The Applying geometry notebook shows how to use detector geometry to assemble data into an image. We can also examine geometry information without any data, to check for problems.
[1]:
%matplotlib inline
from itertools import product
import numpy as np
import matplotlib.pyplot as plt
import h5py

from karabo_data import RunDirectory
from karabo_data.geometry2 import LPD_1MGeometry
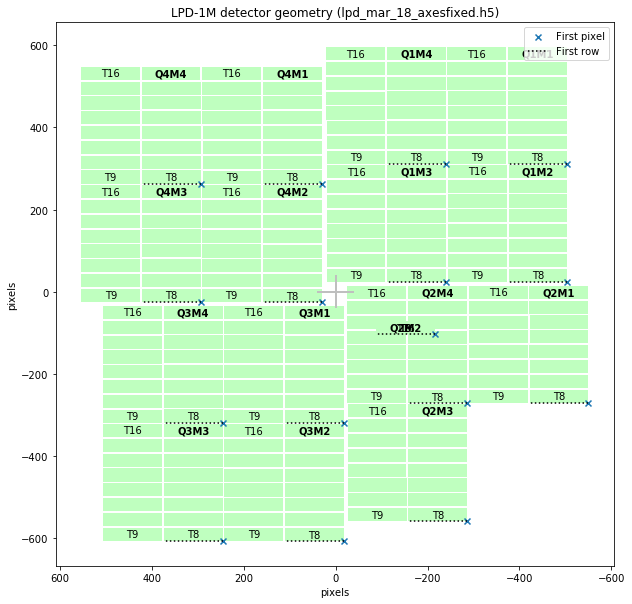
This is some geometry for LPD. You can see that Q2M2 is ‘missing’ - in fact all its tiles are showing up in Q2M4.
Each module has tiles 1-16 running anticlockwise from the top left (looking into the beam). To make it visually clearer, only three corner tiles of each module are numbered.
Here we are loading the geometry from a file, but in the future it will be possible to get the information from the calibration database directly.
[2]:
# From March 18; converted to XFEL standard coordinate directions
quadpos = [(11.4, 299), (-11.5, 8), (254.5, -16), (278.5, 275)]  # mm
geom = LPD_1MGeometry.from_h5_file_and_quad_positions('lpd_mar_18_axesfixed.h5', quadpos)
[3]:
geom.inspect()
[3]:
<matplotlib.axes._subplots.AxesSubplot at 0x2ba73fa92a58>